
Warning: Undefined variable $post_id in /var/www/html/techmantra/wp-content/themes/techmantra/salesforce.php on line 19
Power Bi Data Visualization
Home / Power Bi Data Visualization
Data Visualization: Simplified by TechMantra using Power BI & What is Power BI?
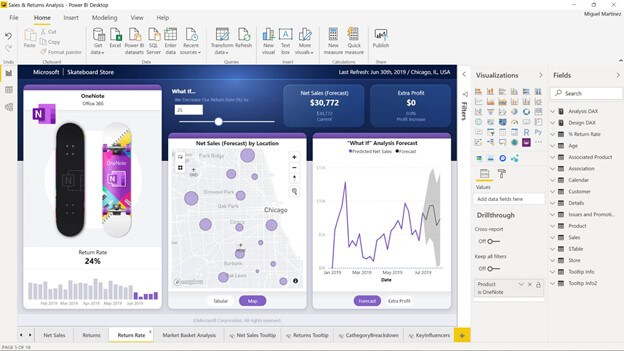
Power BI can help you create simple tabular form reports and can be scales up to the level wherein you can create interactive and Realtime visual reports. Previously a cross platform report, which seemed impossible to create can not be created in a matter of minutes. TechMantra one of Microsoft’s premium partner, has helped various clients in adopting to the Power BI Platform. With it’s team of Power BI Experts, TechMantra can help you implement Power BI and make sense out of the tons of data existing in your organization. Power BI can connect with legacy systems like ERP, CRM, HRMS, Warehouse, Accounting, excel based data or any application for that matter and the users can handle the data centrally to create interactive and real time reports. A sample of one of many possible visual reports:
500+
Projects Delivered
98%
Client Satisfaction
The Power Of Visualization & What is Power BI?
Data Visualization, is the need of today’s dynamic nature of business. For an organization, it is extremely important not only to store data but to store it and present it in a way which will help them take critical business decisions. That is where tools like Power BI from Microsoft are the most helpful.
Power Bi
Power BI can help you create simple tabular form reports and can be scales up to the level wherein you can create interactive and Realtime visual reports. Previously a cross-platform report, which seemed impossible to create can not be created in a matter of minutes. TechMantra one of Microsoft’s premium partner, has helped various clients in adopting to the Power BI Platform. With its team of Power BI Experts, TechMantra can help you implement Power BI and make sense out of the tons of data existing in your organization. Power BI can connect with legacy systems like ERP, CRM, HRMS, Warehouse, Accounting, excel based data or any application for that matter and the users can handle the data centrally to create interactive and real time reports. A sample of one of many possible visual reports:
As you can notice in the reference image, Power BI platform gives you the option to connect with multiple data sources at the same time, create data assets which then can be turned into interactive reports. The picture also showcases the multiple visualization option available to users. Unlike legacy BI Platform a Power BI user need not be technically hands on with the technology platform as reports and visualization can be creates with just clicks and drags and instantaneously.
Certified Power Bi Experts
Our team holds multiple Microsoft and power bi certifications.
Rapid Deployment
Quick implementation of Microsoft solutions.
24/7 Support
Round-the-clock technical support.
Connect With TechMantra & Explore:
For the Power bi implementation and Power Bi resources
The Power or the Power BI Platform:
As mentioned, TechMantra has helped numerous customers in implementing the Power BI platform. In the journey, TechMantra’s technical team has integrated with various data sources bot on-cloud, on-premise to give a central platform for reporting to various teams, departments and management. Our customers have used these reports to make critical business decisions and for make day to day operational level decisions. Connect with our team to discuss and explore if your organization needs a tool like Power BI and how it can be utilized.